Plik:Tropospheric profile Uranus.png

Rozmiar podglądu – 776 × 600 pikseli. Inne rozdzielczości: 311 × 240 pikseli | 621 × 480 pikseli | 994 × 768 pikseli | 1280 × 989 pikseli | 2560 × 1978 pikseli | 3300 × 2550 pikseli.
Rozmiar pierwotny (3300 × 2550 pikseli, rozmiar pliku: 110 KB, typ MIME: image/png)
| Plik Tropospheric profile Uranus.png znajduje się w Wikimedia Commons – repozytorium wolnych zasobów. Dane z jego strony opisu znajdują się poniżej. |
Opis
| Opis |
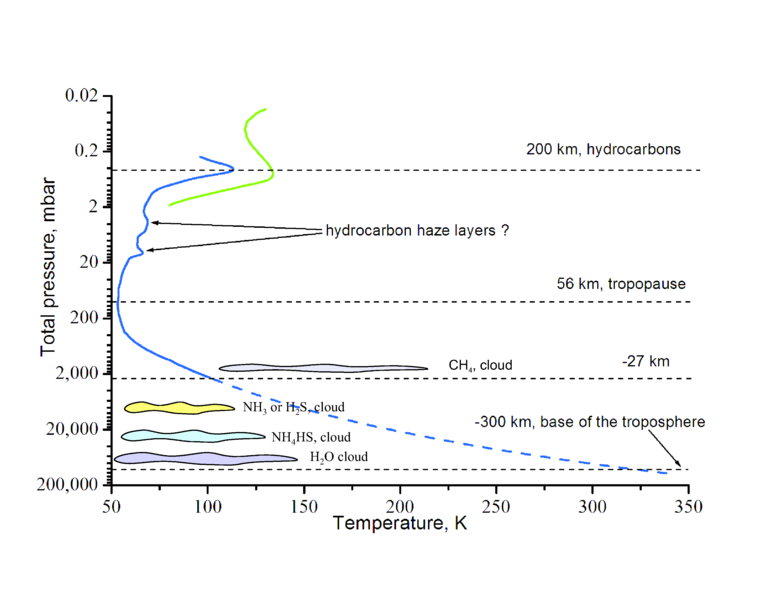
English: This graph shows temperature profile in the en:troposphere and in the lower en:stratosphere of en:Uranus. Heights are also indicated.
References
|
| Data | 25 sierpnia 2007 (data pierwszego przesłania pliku) |
| Źródło | Praca własna (Tekst oryginalny: „Self-made”) |
| Autor | Ruslik0 |
| Inne wersje |
Licencja
Ruslik0 at the English Wikipedia – właściciel praw autorskich do tego dzieła, udostępnia je na poniższej licencji

|
Udziela się zgody na kopiowanie, rozpowszechnianie oraz modyfikowanie tego dokumentu zgodnie z warunkami GNU Licencji Wolnej Dokumentacji, w wersji 1.2 lub nowszej opublikowanej przez Free Software Foundation; bez niezmiennych sekcji, bez treści umieszczonych na frontowej lub tylnej stronie okładki. Kopia licencji załączona jest w sekcji zatytułowanej GNU Licencja Wolnej Dokumentacji. |
| Ten plik udostępniony jest na licencji Creative Commons Uznanie autorstwa – Na tych samych warunkach 3.0. | ||
| Uznanie autorstwa: Ruslik0 at the English Wikipedia | ||
| ||
| Ten szablon został dodany jako element zmiany licencjonowania. |
Oryginalny rejestr przesyłania
Oryginalna strona opisu była tutaj. Wszystkie poniższe nazwy użytkowników odwołują się do en.wikipedia.
- 2007-08-25 17:38 Ruslik0 3300×2550× (112338 bytes) This graph shows temperature profile in the troposphere and in the lower stratosphere of Uranus. Heights are also indicated. Blue curve is from Lindal, G.F., Lyons, J.R., Sweetnam, D.N., Eshleman, V.R., Hinson, D.P., Tyler, G.L., 1987. The atmosphere of
- 2007-08-25 13:51 Ruslik0 3300×2550× (96492 bytes) This graph shows temperature profile in the troposphere and in the lower stratosphere of Uranus. Heights are also indicated. Blue curve is from Lindal, G.F., Lyons, J.R., Sweetnam, D.N., Eshleman, V.R., Hinson, D.P., Tyler, G.L., 1987. The atmosphere of
Historia pliku
Kliknij na datę/czas, aby zobaczyć, jak plik wyglądał w tym czasie.
| Data i czas | Miniatura | Wymiary | Użytkownik | Opis | |
|---|---|---|---|---|---|
| aktualny | 17:23, 1 gru 2008 | | 3300 × 2550 (110 KB) | File Upload Bot (Magnus Manske) | {{BotMoveToCommons|en.wikipedia}} {{Information |Description={{en|This graph shows temperature profile in the en:troposphere and in the lower en:stratosphere of en:Uranus. Heights are also indicated. *The '''blue''' curve is from Lindal |
| 17:23, 1 gru 2008 |  | 3300 × 2550 (110 KB) | File Upload Bot (Magnus Manske) | {{BotMoveToCommons|en.wikipedia}} {{Information |Description={{en|This graph shows temperature profile in the en:troposphere and in the lower en:stratosphere of en:Uranus. Heights are also indicated. *The '''blue''' curve is from Lindal |
Lokalne wykorzystanie pliku
Poniższa strona korzysta z tego pliku:
Globalne wykorzystanie pliku
Ten plik jest wykorzystywany także w innych projektach wiki: