Plik:US2009FederalExpenditures.png
Rozmiar podglądu – 600 × 599 pikseli. Inne rozdzielczości: 240 × 240 pikseli | 481 × 480 pikseli | 769 × 768 pikseli | 1025 × 1024 pikseli | 2099 × 2096 pikseli.
Rozmiar pierwotny (2099 × 2096 pikseli, rozmiar pliku: 107 KB, typ MIME: image/png)
| Plik US2009FederalExpenditures.png znajduje się w Wikimedia Commons – repozytorium wolnych zasobów. Dane z jego strony opisu znajdują się poniżej. |
Opis
| Opis |
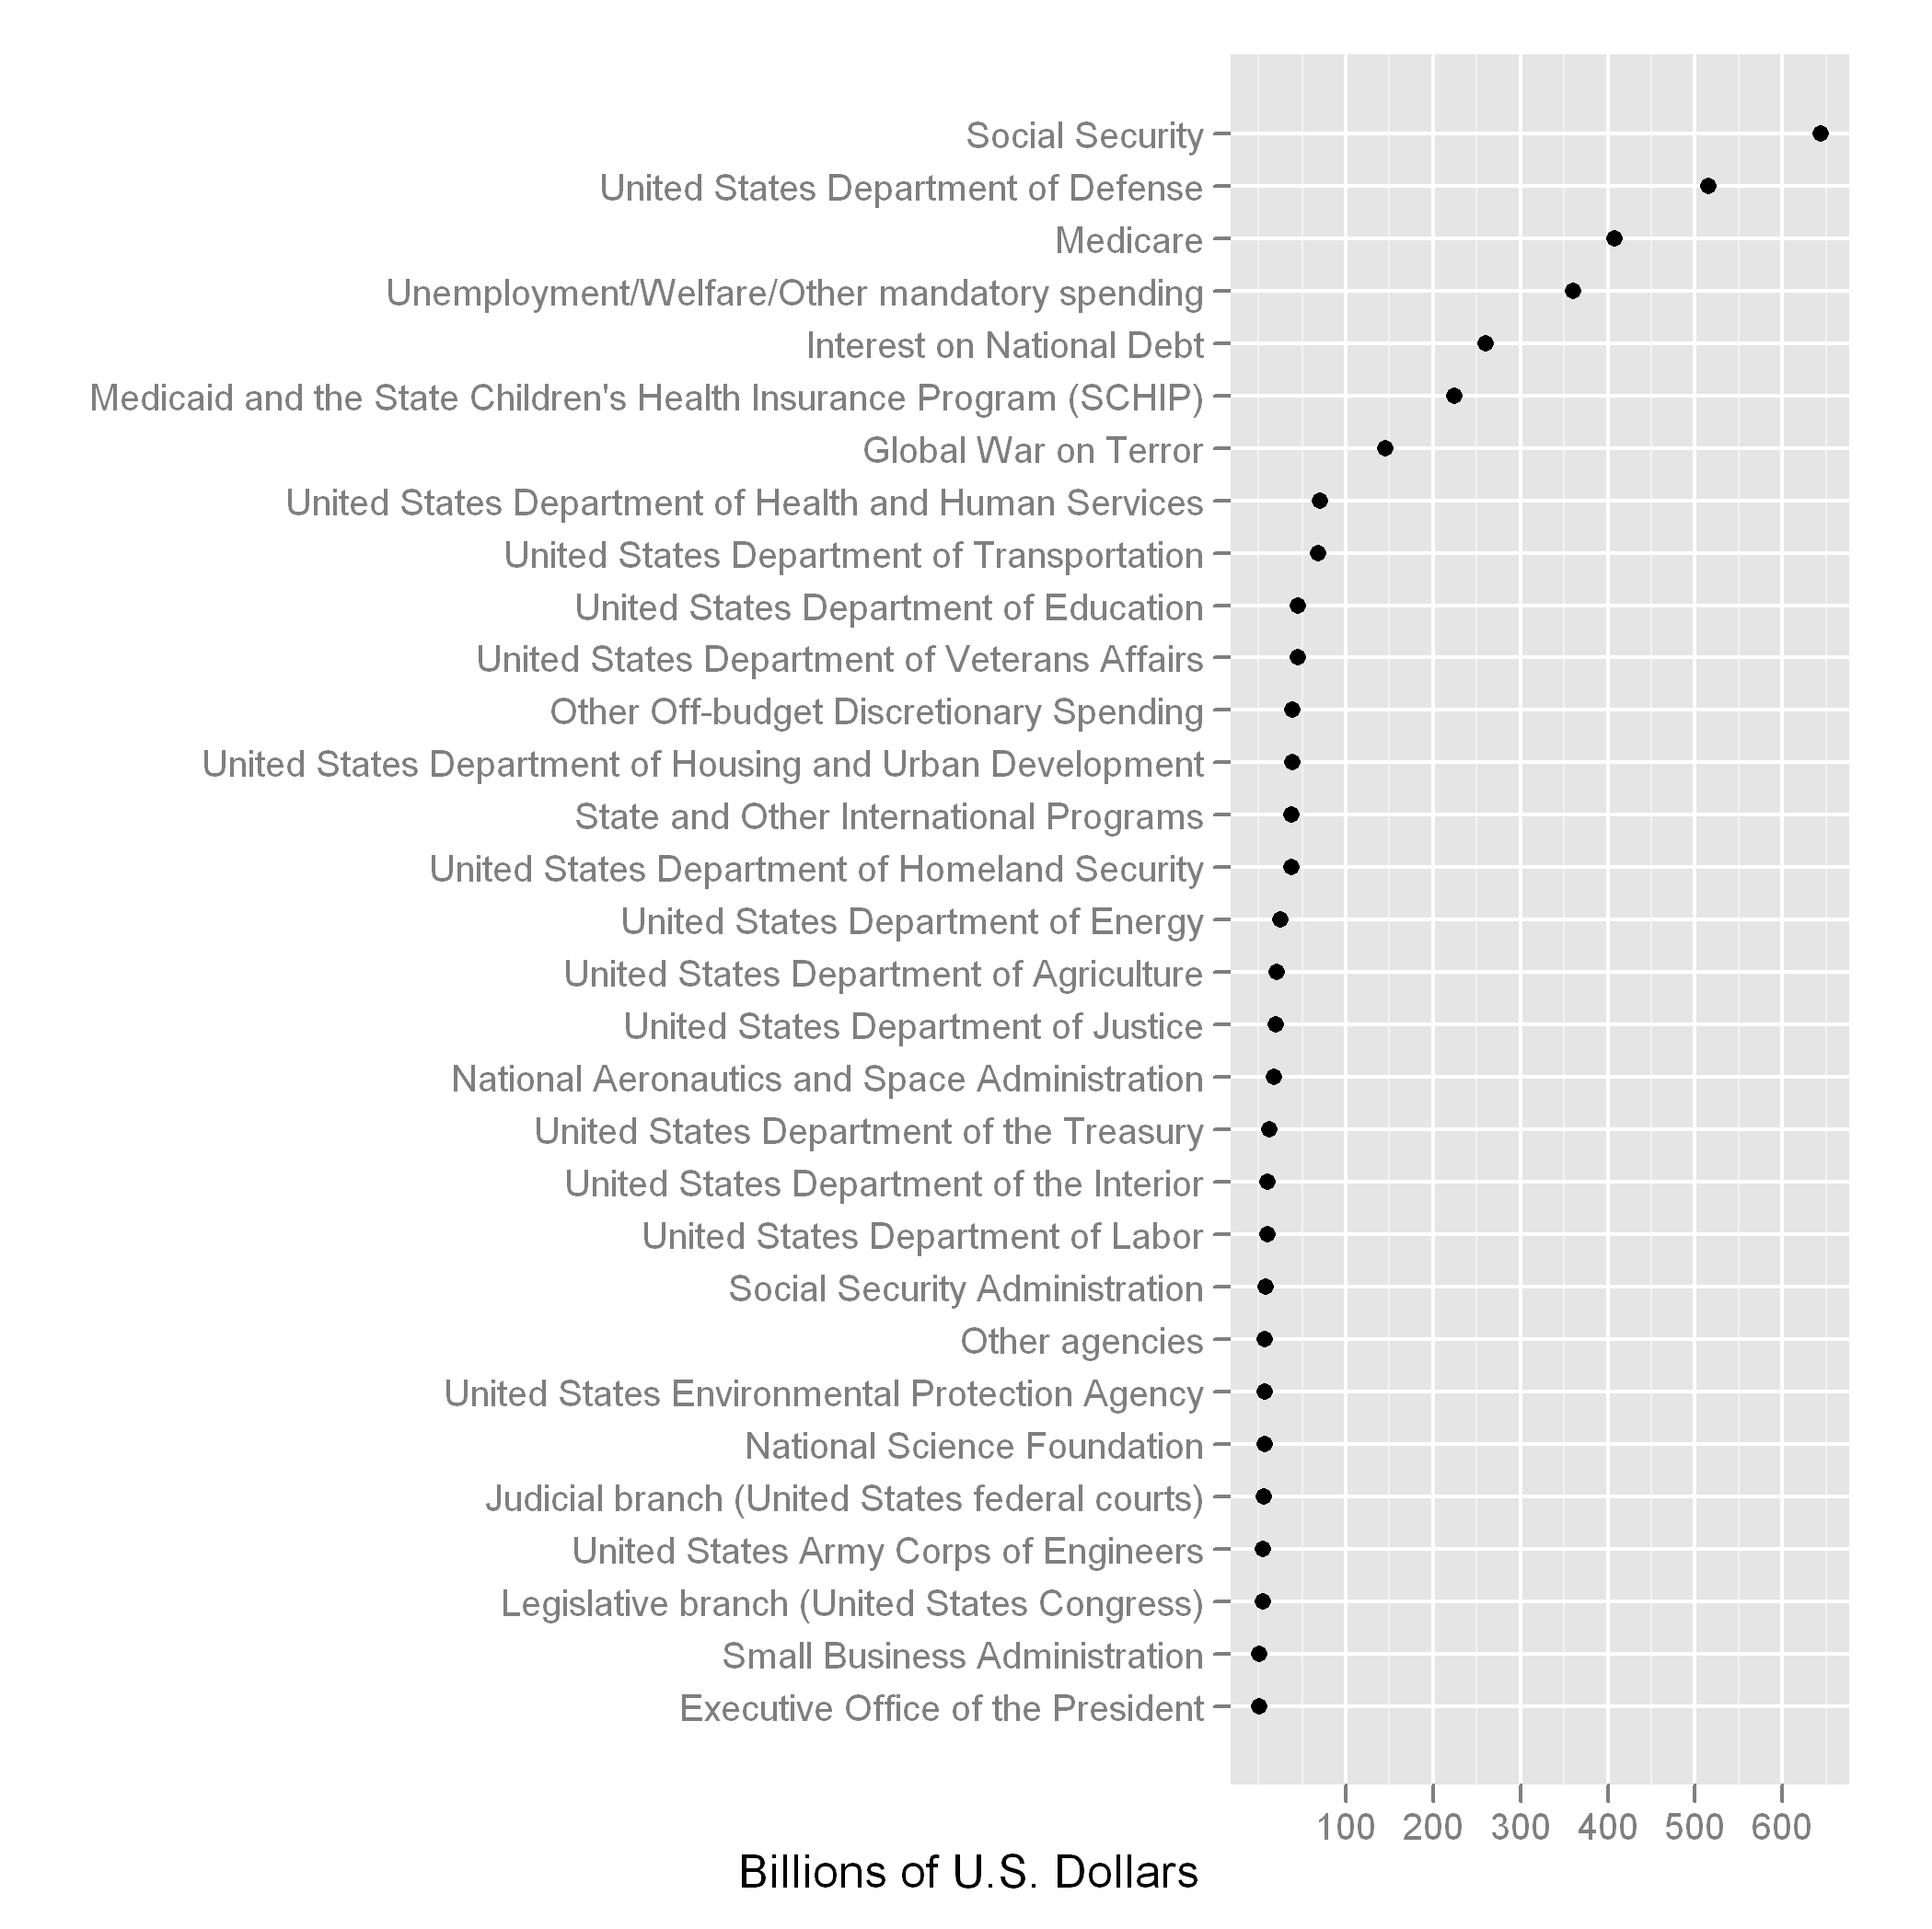
English: Dot plot of the total U.S. government budget in 2009, including both mandatory and discretionary. Taken from data at wikipedia:2009 United States federal budget. |
| Data | |
| Źródło | Praca własna |
| Autor | Thopper |
| Inne wersje | File:Fy2009spendingbycategory2.png |
Creation Technique
General steps
- Compile data from list of budget items at wikipedia:2009 United States federal budget and save to a file (e.g. "2009expenditures.csv");
- Load data in R (programming language);
- Load the ggplot2 library;
- Assign the categorical variable (outlay) as a factor;
- Plot using the ggplot.
Compiling the data
- Compile the data into columns: one column for the budget expenditure (e.g. "Social Security," "Medicare," etc.) and the other for the amount ("644," "408," etc.).
- Name the columns "Expenditure" and "Billions" for the expenditure category and the amount (in billions of U.S. dollars), respectively.
- Save the data as comma-separated value file (csv).
R code to produce chart
# Load the ggplot2 library
library("ggplot2")

# Data saved using European separators ("." for thousands and "," for decimals), so use read.csv2().
# If data is saved using U.S. separators ("," for thousands and "." for decimals), use read.csv().
my.data <- read.csv2("2009expenditures.csv")

# Ensure that the categories are treated as factors
my.data <- data.frame(Billions = my.data$Billions, Expenditure = factor(my.data$Expenditure))

# Plot using ggplot2
ggplot(data = my.data, aes(Billions)) +
      geom_point(aes(y=reorder(Expenditure, Billions))) +
      xlab("Billions of U.S. Dollars") + ylab("")
Licencja
Ja, właściciel praw autorskich do tego dzieła, udostępniam je na poniższej licencji
Ten plik udostępniony jest na licencji Creative Commons Uznanie autorstwa – Na tych samych warunkach 3.0.
- Wolno:
- dzielić się – kopiować, rozpowszechniać, odtwarzać i wykonywać utwór
- modyfikować – tworzyć utwory zależne
- Na następujących warunkach:
- uznanie autorstwa – musisz określić autorstwo utworu, podać link do licencji, a także wskazać czy utwór został zmieniony. Możesz to zrobić w każdy rozsądny sposób, o ile nie będzie to sugerować, że licencjodawca popiera Ciebie lub Twoje użycie utworu.
- na tych samych warunkach – Jeśli zmienia się lub przekształca niniejszy utwór, lub tworzy inny na jego podstawie, można rozpowszechniać powstały w ten sposób nowy utwór tylko na podstawie tej samej lub podobnej licencji.
Historia pliku
Kliknij na datę/czas, aby zobaczyć, jak plik wyglądał w tym czasie.
| Data i czas | Miniatura | Wymiary | Użytkownik | Opis | |
|---|---|---|---|---|---|
| aktualny | 16:34, 17 wrz 2010 | | 2099 × 2096 (107 KB) | Thopper | {{Information |Description={{en|1=Dot plot of the total U.S. government budget in 2009, including both mandatory and discretionary. Taken from data at wikipedia:2009 United States federal budget.}} |Source={{own}} |Author=Thopper |Dat |
Lokalne wykorzystanie pliku
Poniższa strona korzysta z tego pliku:
Globalne wykorzystanie pliku
Ten plik jest wykorzystywany także w innych projektach wiki: